Here it finally is, the blog about the performance we achieved with our shoebox sized datacenter at the NLVMUG conference. I discussed the hardware and software in my previous posts. Let me quickly explain the test setup first though.
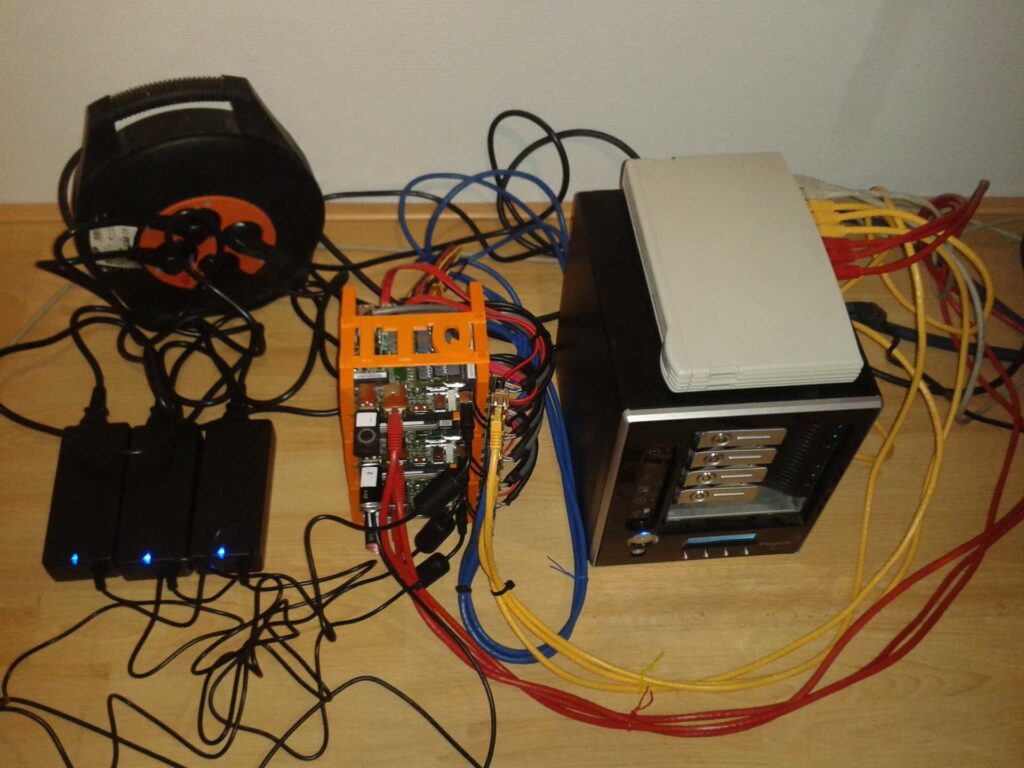
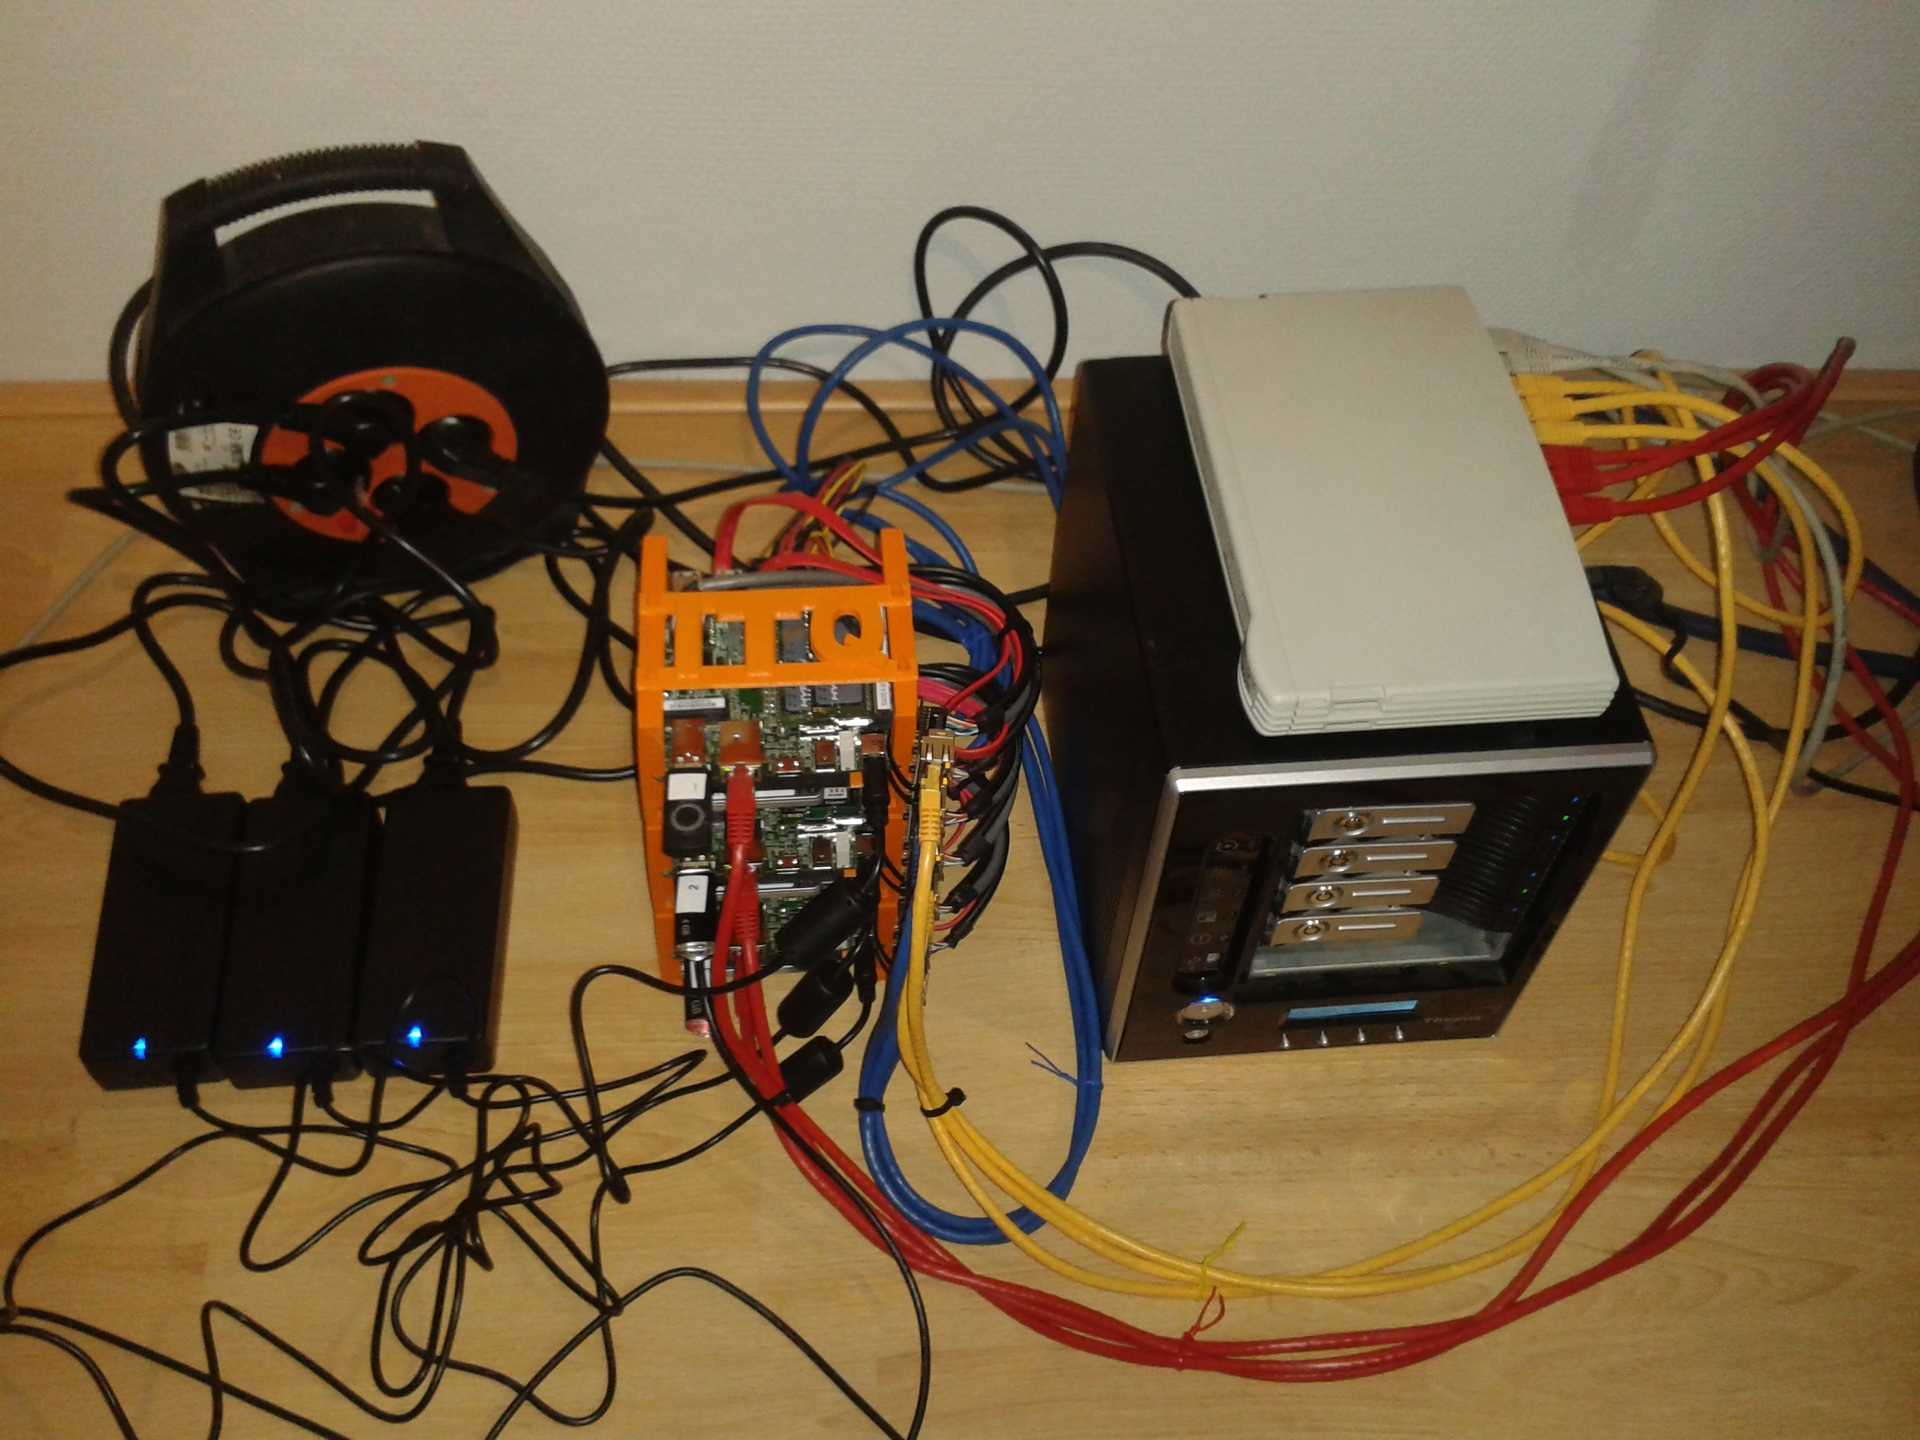 This contraption does close to 160000IOPS
Test setup
We used three virtual machines running ubuntu 12.04, one VM on each NUC. Each VM has 2vCPUs and 4GB of RAM assigned and has an additional disk attached to a PVSCSI adapter. That disk is formatted with ext4 using 4KB block size and the partition is aligned on 4KB. The mount option “noatime” is used to prevent unnecessary disk writes.
All three load generators run FIO. FIO uses job files to configure the workload. Below is the job file I used for the read only tests.
rw=randread blocksize=4k blockalign=4k iodepth=32 direct=1 size=1g runtime=120 time_based filename=/mnt/bench/test.fileThis gives us 100% random, 100% read operations of 4KB in size. Queue depth used in 32 and the file size is 1gig. De file below was used for to run read/write combining tests
rw=randrw rwmixwrite=25 blocksize=4k blockalign=4k iodepth=32 direct=1 size=1g runtime=120 time_based filename=/mnt/bench/test.fileSo this gives us 4KB sized read or writes. 100% of the operations is random and 25% are write operations.
The results
100% read without acceleration
First test is a test without any PernixData FVP acceleration, so this shows the performance of the small iSCSI NAS we used. I have to say the performance is pretty unreliable as the people who attended our session will notice that the values showed here are not exactly the same they saw on the big screen. Anyways, Here is the performance graph of a test with 1, then 2, then 3 VMs hammering on the iSCSI NAS:
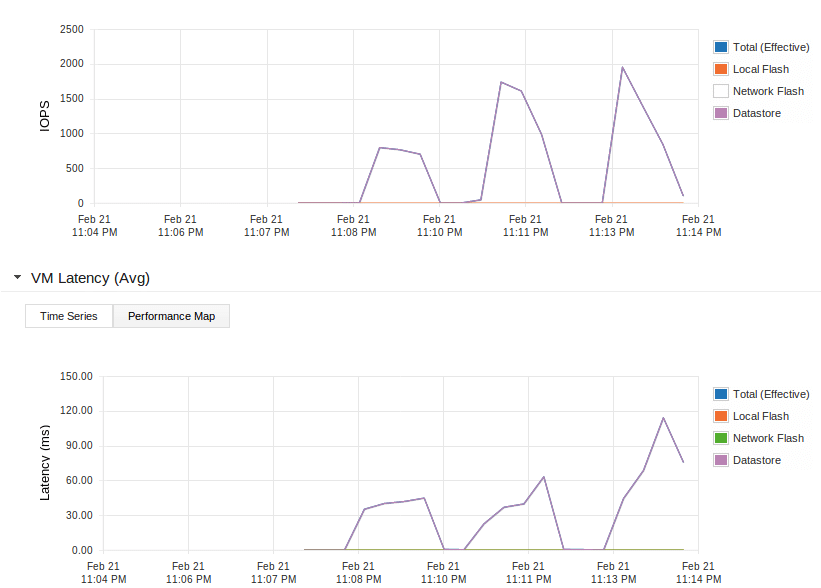
Let’s take a look at the upper graph here which shows the number of IOPS. As you can see the performance scales up nicely when adding the second VM (2nd spike in the graph). Probably because the data for the first one was already in the NAS cache. When running the test from 3 VMs (3th spike in the graph) the number of IOPS only increases a bit. But that’s not the whole story. Take a look at the lower graph. This shows the latency to the datastore during the tests. The latency with just one VM is already very high. But with three VMs simultaneously hammering away on the NAS the latency shoots up. This is absolutely killing the performance and user experience on the VMs. Not only on the VMs running the test but all other VMs basically come to a standstill as well.
100% read with FVP acceleration
Now let’s enable PernixData FVP so we start caching on those nice Intel DC S3700 SSDs and run the same test. When starting this test a new test file is generated. Because FVP supports write-back caching this file is now in cache already. No need to warm up the cache.
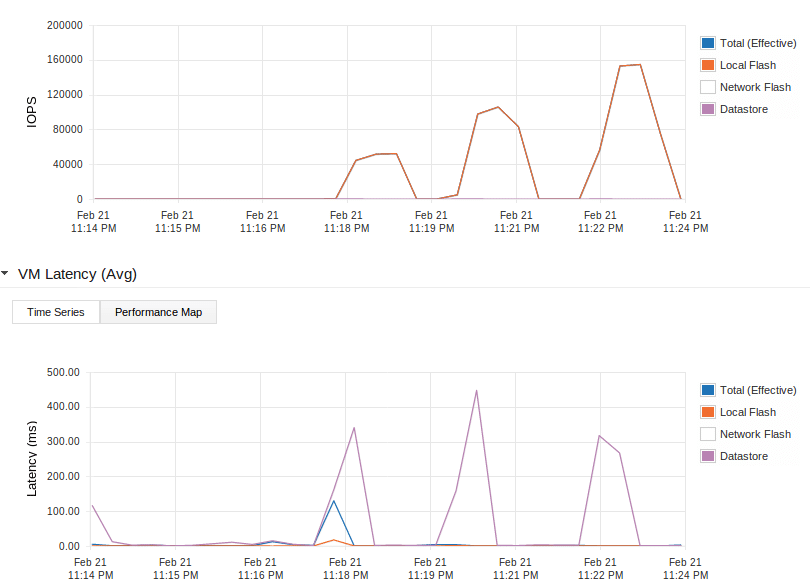
Again the upper graph is the number of IOPS, the lower is the Latency. You may notice the different colors in the graph now. In the previous test we just used the datastore, no flash. In this test the red line represents the local flash and the purple line the datastore.
This first spike in the upper graph shows the results of the read test using only 1 VM. That’s around 52000 IOPS for 1 VM! The purple line in the lower graph shows the latency to the datastore. The blue line shows the latency experienced by the VM. This spikes shortly because the cache was still busy destaging the test file we just generated to the slow NAS. Then the effective latency drops to the same value as the red line which is the local flash. In other words: the latency experienced by the VM is the local flash latency which is 1ms or lower.
Now we rerun the test with 2 VMs which run on 2 separate servers. This is shown in the second spike. As you can see the performance is doubled! But the latency stays close to 0! The same goes for the third VM running on yet another node, 52000 more IOPS are added, latency stays low. The total amount of IOPS achieved in this test was 154.659 IOPS while the latency stays close to 0! Which is incredible for a bunch of 10x10cm boards with dualcore CPU’s and an 8 years old NAS if you ask me. For the record, during our live demo at NLVMUG we did even a little more IOPS, around 158000.
25% writes with FVP acceleration
We also ran a test with read/writes combined. This will obviously yield lower results but I think it’s still impressive.
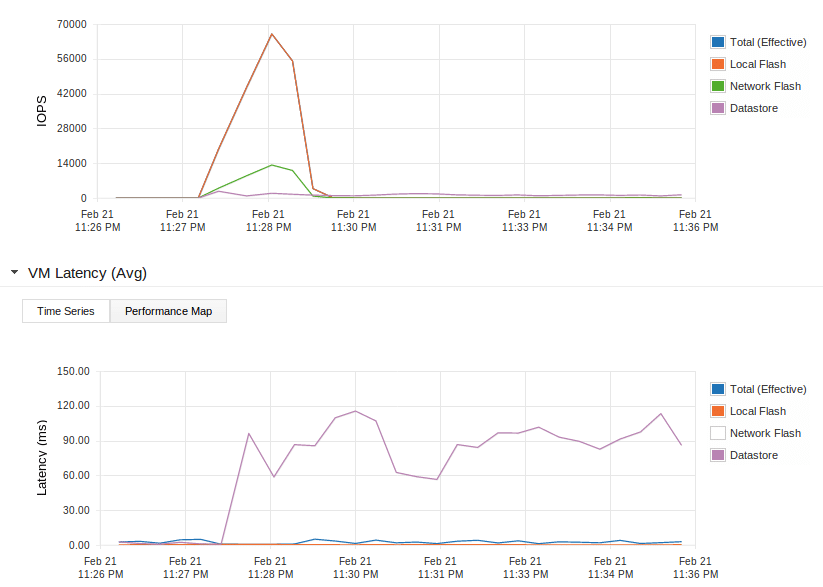
This test was done with 3 VMs at once. The red line in the upper graph again shows the IOPS to/from the local flash. You see it spike up to 66025 IOPS and the blue and red latency lines in the lower graph stay very low. You’ll also notice a green line in the upper graph. This is the amount of write IOPS sent over the network to other nodes to protect the data. Note that this happens over a 1Gb network only.
So every write is replicated over a 1Gb network to another SSD. This increases the latency a bit. On top of that we loose some IO capacity because we have to write everything twice. Still with this replication of write IOs the latency stays low and the number of IOPS is pretty high.
The purple line in both graphs shows the activity on the NAS. You’ll see that the number of IOPS to the NAS is low and the latency on the NAS is very high. But the VMs experience the latency indicated by the blue line which is nice and low.
Destaging
Something else you may notice in the graphs above is that the number of IOPS and the latency stays above 0 for the purple line even after the test is over. This is because the cache keeps destaging the cached writes to the NAS. The slower the backing storage, the longer this will take but it will be finished at some moment as you can see in the image below.
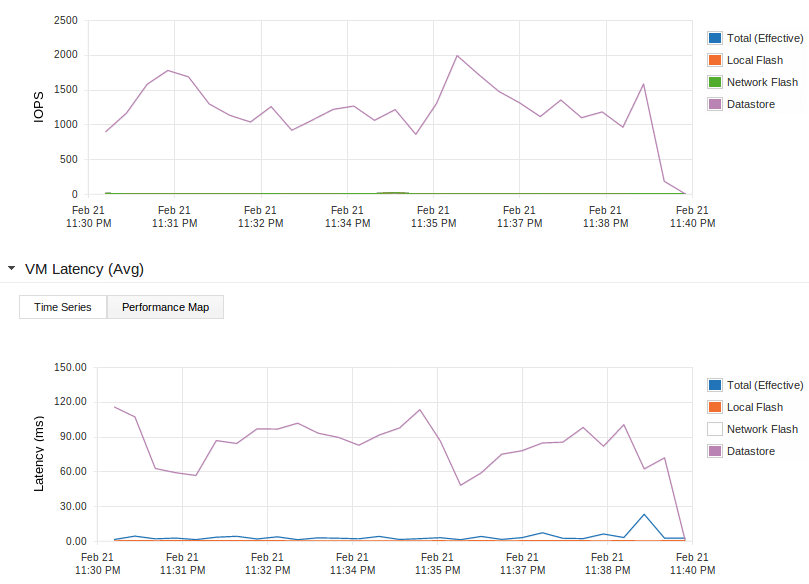
What happens if you sent more write IOs then the cache can store you might wonder? Well, some clever part of the FVP software will just decide to artificially increase the latency to your VMs so the inbound number of IOPS drops a bit. Will still be way better then the IOPS you could achieve with just your backing storage though.
To the people at VMware
If anybody at VMware involved with their VSAN performance test is reading this: We showed how we did this, please share your test setup and show us how you achieved the numbers mentioned in this slide. Just so we know how to get great performance from VSAN as well!