
I needed to get more insight into what is happening with resyncs on vSAN cluster for my customer so i decided to look to vROPS to get that and this is what i came up with to see what is going and and also be able to look back and see what happened.
First of all we need to make a view to be able to select a cluster in a object picker :

Select the correct vSAN subject which is the one under the vSAN Adapter :

Now we just need the column that states if there is any objects resyncing which we get from the data part by dragging it into the right side :

Now we just need to make the actual dashboard and first drag a list view onto it


After you configure the List view we can add 2 metric charts, one for the resyncing objects and the other for the amount of data and then link them.


When you did that just make the interactions in the dashboard like this :

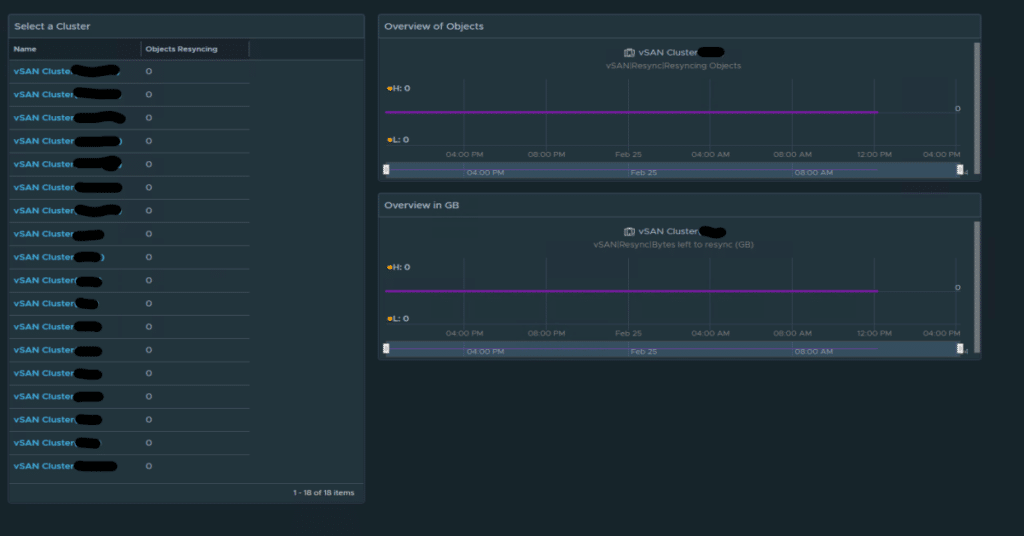
and this is the result of your new Resync Dashboard.

The original article was posted on: www.hollebollevsan.nl