In the past you might have read quite some articles about monitoring solutions on my blog. I believe monitoring is essential to any solution that needs to be compliant to a Service Level Agreement (SLA). If you agree to something, let’s say your application needs to have a minimum uptime of 99,9%, you need to be in control of all of the components that might impact that number. If a modern three tier application has a back-end that runs on a certain platform and the front-end runs inside a virtual desktop, which in its case is being offered to and end user through external connectivity, having insights in the entire chain is important. Quite recently I stumbled upon a solution that offers monitoring of that entire chain: eG Enterprise by eG Innovations.
How often does it happen that an end user is complaining about performance? The answer to that question should hopefully be never, but reality probably is more in the direction of all the time. That’s because anything that limits the user’s User Experience is quite often seen as a performance issue. The fact that a browser might be slow could be due to a lot of different reasons: resource issues in a (virtual) desktop (CPU/RAM/IOPS constraints), graphical acceleration issues, older version of the browser, a wrong browser, but also a slow web-based application. Diving into all of these possible causes might seem a bit time-consuming, except if you have a tool that shows the whole chain. That’s exactly what eG Enterprise offers. Every component that is part of the chain that you are responsible for, can be added to the solution and is instantly monitored. eG Enterprise figures out which components are talking to each other and creates a topology of the whole chain:

It’s the first time I came across a solution that is able to present a topology like this in such a simple way, and also for any type of device it is able to monitor. In this case, it shows the complete VMware Horizon topology, which is really nice. When zooming a bit in on the individual components and there respective metrics, in an easy overview you are able to see what the most important metrics are.
Zooming in on an individual component gives an overview of all of the metrics which are monitored for that specific component:
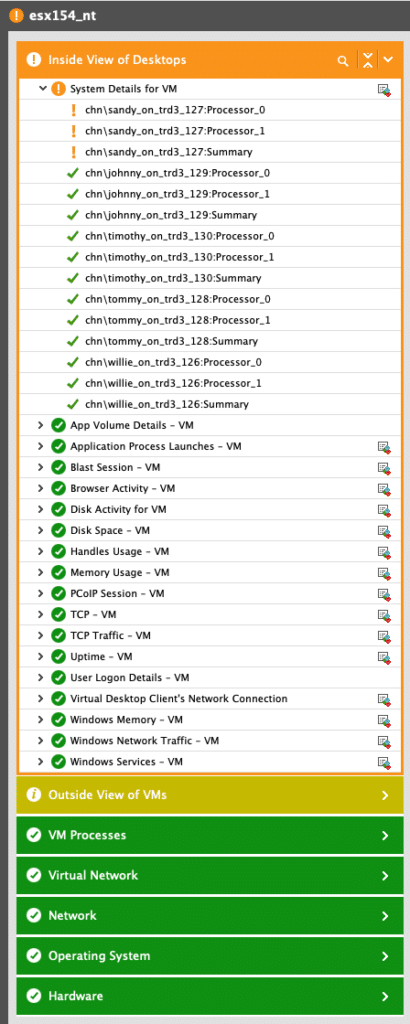
What you can see here is that user sandy has a possible CPU issue. A CPU can be constrained by multiple factors, so going into detail on the session of the user sends you to a UX Engineers wet dream (and it’s just half the dashboard because it didn;t fit on my 4K monitor :)):
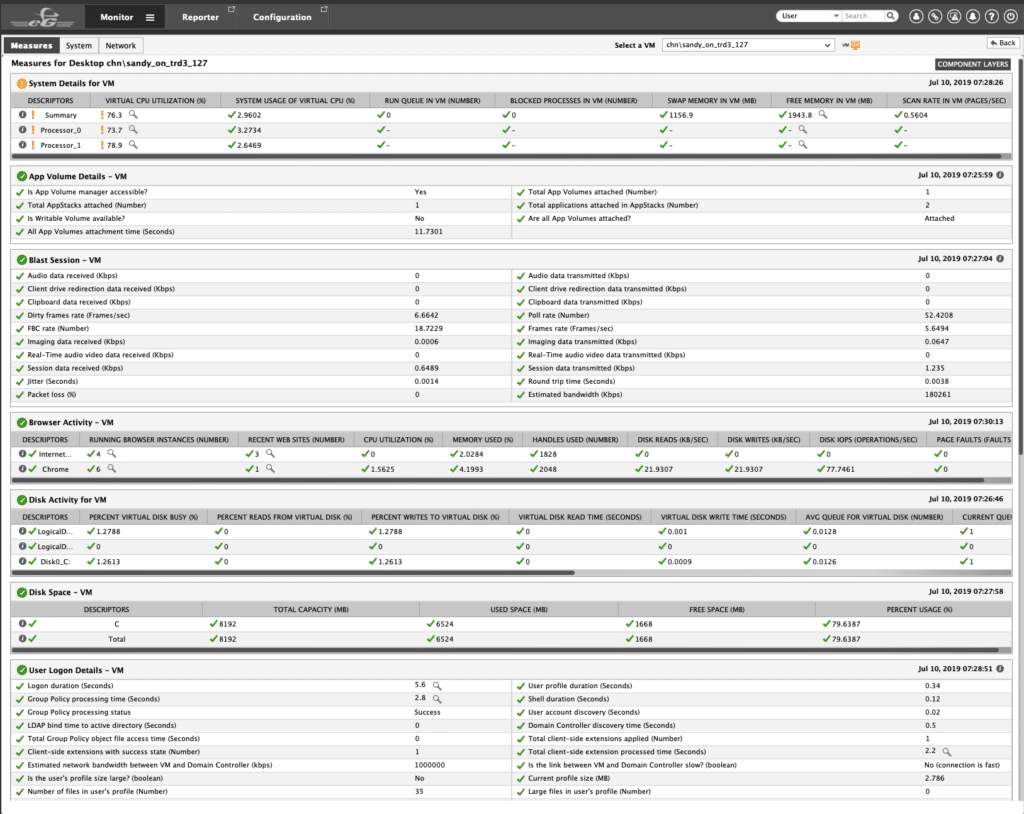
In this overview of basically EVERYTHING you would like to see, related to the UX of the end user, the CPU metrics again are colored differently to attract your attention. Connection Protocol details (per channel), GPU details, VM details, etc, everything required to know what the end user is experiencing is basically there. Diving a layer deeper shows the actual reason behind the spiking CPU:
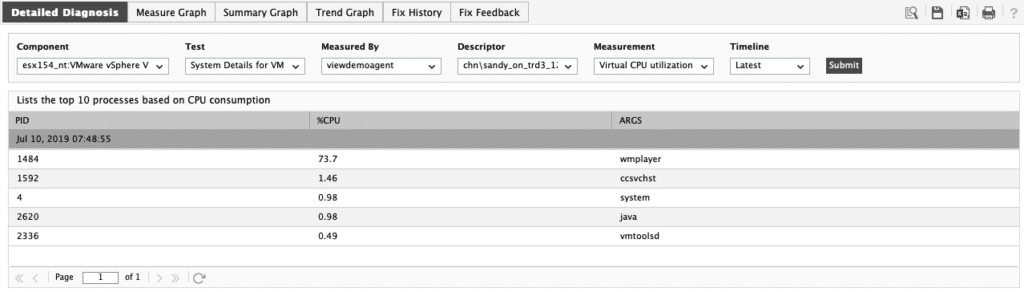
Windows Media Player is actively being used. Maybe to watch one of my light board videos 
Being able to dig into issues and find the cause with so much ease is something I am seriously impressed by. It’s even possible to dive another level deeper and run a code-level inspection, but I wasn’t able to test that out.
Logon Simulator
Although eG focusses on the complete stack, they have a couple of VDI features that are seriously cool. The first being the free logon simulator. This is an online service that (with just 5 minutes of configuration / deployment) lets you run a repetitive logon simulation on your own VDI stack (both VMware and Citrix). The result is displayed in the same way as eG Enterprise:
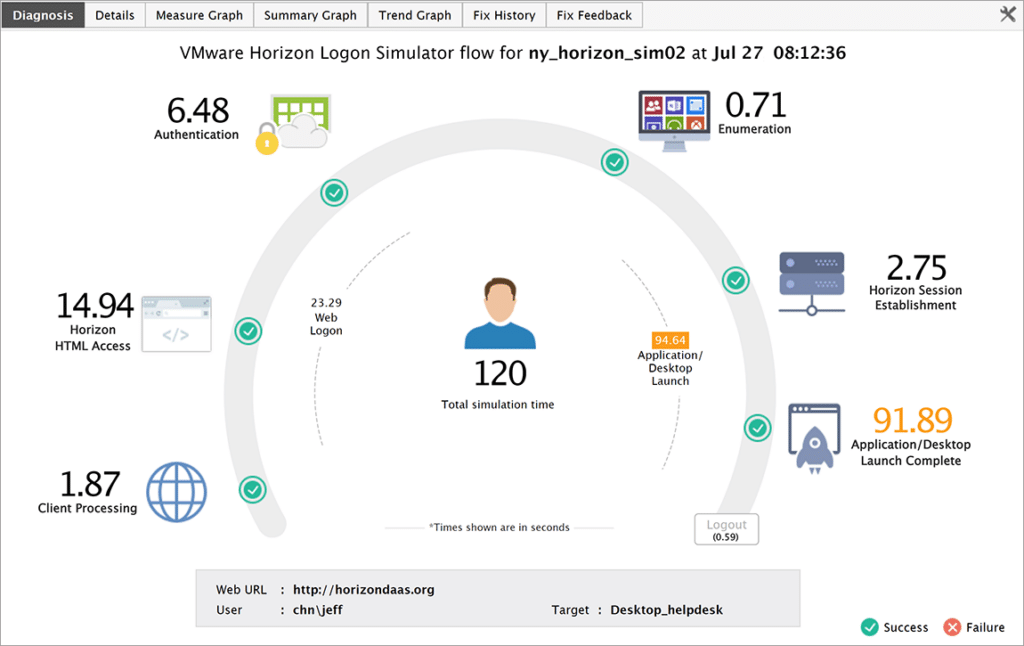
You can sign up for free for the Logon Simulator here.
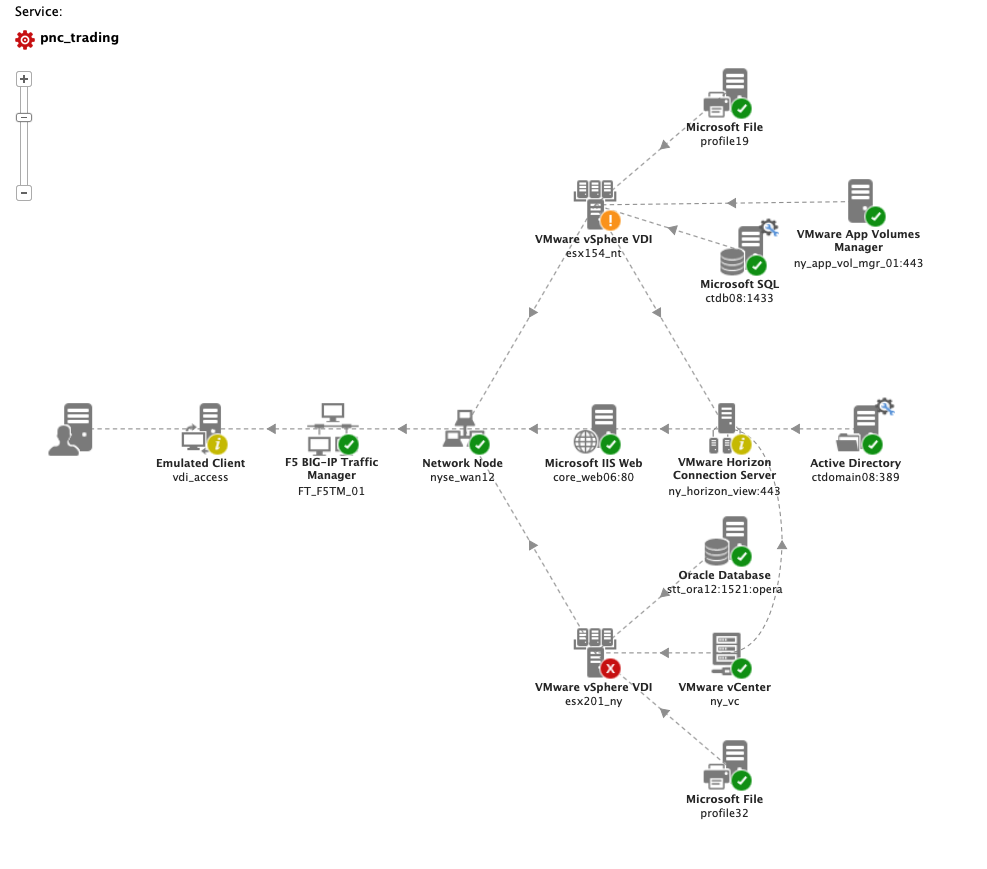
What about non-EUC use cases?
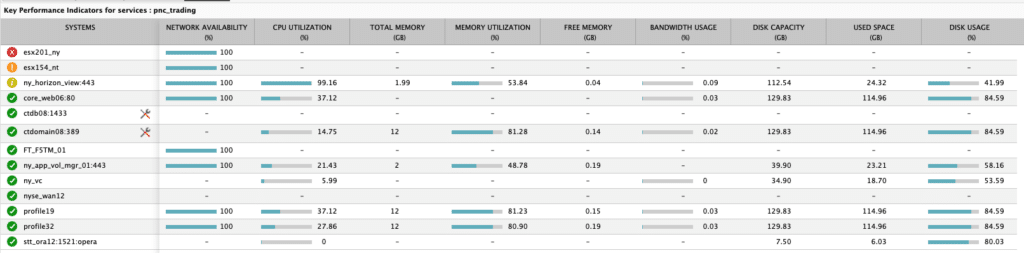
eG Enterprise doesn’t only focus on EUC-related services, but also offers the possibility to monitor your three-tier applications. All individual components that belong to a single service are again showed in a topology overview:
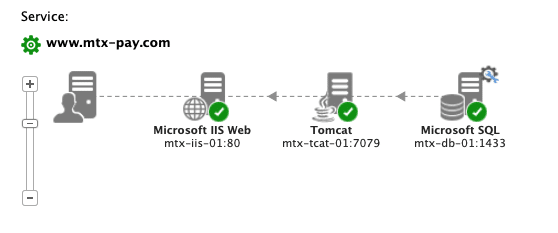
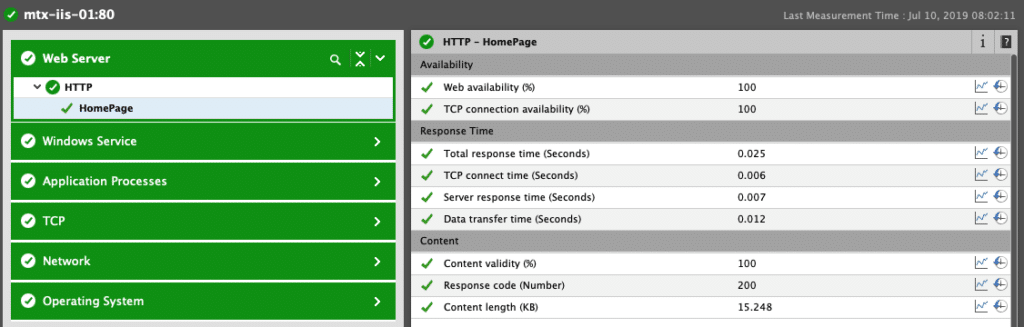
In this case, nothing is causing any issues, but in case it does, all kinds of metrics belonging to a specific component are being monitored. In this case, metrics like response times and content length can easily be accessed:
Conclusion
I hope this post gave you an overview of some of the features of eG Enterprise by eG Innovations. The solution is too extensive to cover in a single blog post, but I tried to cover some of the details that I find impressive. If you would like to know more about the use cases, there is a light board series coming up. The free Logon Simulator can be found here and you can request a free demo or trial if you would like to know more about their solutions.
The post Product review: eG Enterprise by eG Innovations appeared first on vHojan.nl.
The original article was posted on: vhojan.nl