UPDATE: I promised testing from within the data center and more documents to test against. Check out the bottom of the post for additional interesting results. Spoiler: data center performance is really good!
On August 21 Microsoft released Azure DocumentDB. As the name implies, it’s a document database. It allows schema-less JSON documents that can then be queried using a SQL-like language. It’s still in preview mode but that doesn’t prevent me from some testing 🙂 ScottGu’s announcement promises linear performance (low-single-digit) scaling because of automatic indexing. Now that’s interesting because usually indexing a data store requires careful planning and is one of the more complex database design topics. So I thought I’d take DocumentDB through a performance test. More specifically, a query performance test. Data usually is read much more than it is written so read performance is more interesting than write performance (at least in my test).
The test is designed as follows:
- Generate a large number of random JSON documents (1048576 in my case). The fact that we have random documents should make it pretty hard for DocumentDB to index them efficiently (assumption!) This also means the test does not represent a real-world scenario. Usually you’d see similarly structured documents inside the same document collection.
- Repeat the following process:
- Import a batch of documents into Azure DocumentDB. After each import the number of documents is respectively 1, 2, 4, 8, 16, 32, 64, 128, 256, 512, 1024, 2048, 4096, 8192, 16384, 32768, 65536, 131072, 262144, 524288, 1048576.
- Determine two sets of test queries against the imported documents. Each set contains 1000 queries. The first set has queries that find a document based on a property at root level in the document, the second set has queries that find a document based on a child-level property. I was curious whether there would be a difference between the two.
- Run each set of queries two times against the current document collection. I was curious whether there would be some kind of learning effect if you repeat the same set of queries. And running each set two times allows us to determine average performance.
To elaborate on bullet 2.2: suppose I have the following JSON document:
{
  "key1" : "value1",
  "key2" : {
    "subKey1" : "subValue1"
  }
}
I would generate two queries:
SELECT d FROM DataSet d WHERE d = "value1"
SELECT d FROM DataSet d WHERE d = "subValue1"
It will be interesting to see whether there is a difference between root-level property indexing and child-level property indexing.
The test itself was run on a laptop with 16GB memory and an Intel Core i7-4600U processor. During the test the CPU utilization of the process did not go above 15% and memory pressure was negligible.
Results
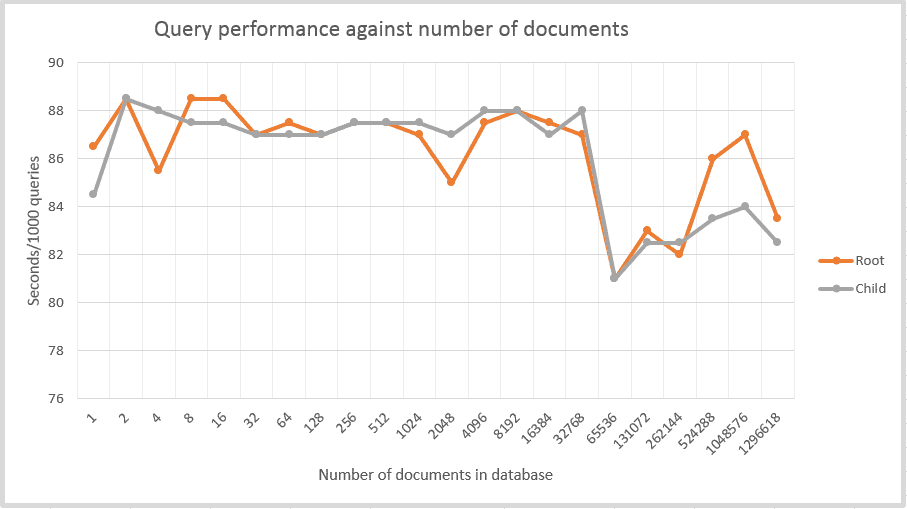
The results are, well, rather uninteresting… 🙂 Summarizing: it doesn’t matter if you perform queries against one document or one million documents. Query performance is not linear but there is no performance degradation when increasing the number of documents to query against. Also, it doesn’t matter if you query a root property or a child property, these are treated similarly. And there is no learning effect: if you run the same batch of queries again, performance is nearly the same. So far, Azure DocumentDB performance seems to scale pretty well.
In the graph you see two lines: one for the root property queries and one for the child property queries. Since I could not detect a learning effect, I averaged the results of the two root and the two child runs. If you’re wondering where data point 1296618 comes from, check out update 1 below.
One interesting observation is on absolute performance. On average my test program used 86 seconds performing a 1000 queries. That’s 86ms per query which is not very fast. Especially since I live about 30km from datacenter West Europe where my database was hosted. This seems to have something to do with location: I ran all tests from the office but when I tested from home, everything was suddenly twice as fast. I suppose I should test from within the West Europe data center to see if performance gets better.
What’s next?
First of all, I’m going to keep adding documents. I have a million of them now and am going to add another million and repeat the same test. And again, and again… Second, ScottGu’s blog post promises low single digit latency which I don’t see in my test. I’m assuming this is because of network latency on my test location. I’ll run other tests from the West Europe data center directly instead of from my own laptop to see if latency drops.
Other observations
Some things I noticed during setting-up of the test (and not having read the documentation too carefully before starting, since everything mentioned below is actually documented…):
- There’s a maximum document size of 16KB. If you try to create a larger document you receive an error (
RequestEntityTooLargeException). There is already a post on the DocumentDB forum explaining why there’s a limit and why it has this value. There is also a very popular feature request for larger document sizes (currently under review) on the DocumentDB feedback site. - You cannot create a query that selects on the keywords
ISandNOT(and as I later discovered:BY,JOIN,AND,OR). I found this out by incident because of the size of my random test set. Somewhere in the set there exist (valid) JSON documents that have property namesISandNOT, possibly leading to queries of the form:SELECT * FROM DataSet d WHERE d.IS = "SomeValue". This leads to aBadRequestException: Syntax error, incorrect syntax near 'IS'. Here is my post on the forum asking how to escape these keywords in a query.
The answer is actually quite easy: just use JSON syntax for getting property values. You can escape any property value simply usingdinstead. - I had one document that was valid according to both JSON.NET and JSONlint.com but that generated a
BadRequestException: The request payload is invalid. Ensure to provide a valid request payload. Since this is a valid document, I have no idea why DocumentDB rejects it so I asked about this on the forum.
The problem with my document was that it uses a property name, in this case_ts, that is also used internally. There are some more internal properties that I assume you can’t use that can be found here. - If your document has a property at root level that is named
id, it must be a string. If it’s either an object or an array you get an error message:Can not convert Object to String(orCan not convert Array to Stringrespectively). This error is generated on the client, not on the server.
Anidproperty is not required: DocumentDB will generate a GUID if you don’t provide one. Check out my forum question here.
Update 1: Document collection quota exceeded
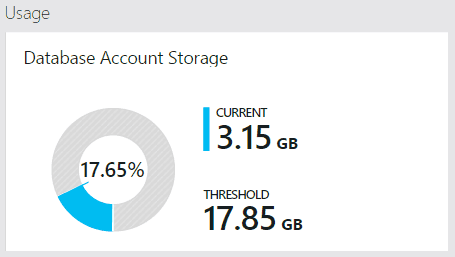
My intention was to keep adding documents to the collection and see if performance degrades. My next batch was supposed to be another 1048576 documents. However, DocumentDB in preview mode allows a maximum of 3.3GB per document collection as described here. The error I receive is a Microsoft.Azure.Documents.ForbiddenException: "Quota exceeded. Consider creation of a new collection". Not sure why I receive this error because the portal reports I’m only using 3.15GB. I asked another question on the forum.
However, I now have 1296618 documents which is still a respectable number. I suppose I could add another collection and add more documents but I also assume that performance of another document collection is the same. Queries are scoped per document collection, not per document database so performance between collections is probably similar.
I ran a final test against the 1296618 documents I have now and added the results to the graph. No spectacular results.
Update 2: Run the test set from the data center
I was a little disappointed by the absolute performance results: each query takes 86ms on average when run from my office location. However, when I run the same test set from home it suddenly drops to about 40ms; location seems to matter. So what if the test is run directly inside the West Europe data center? I created a simple Azure Website with one button and ran the same test as described above. The results are a lot better: we are much closer to the low single digit performance that was promised. Again, there is no difference between root and child queries and there is no learning effect.
The results are (average results per query from one test run):
- Root queries: 7.6838ms
- Child queries: 7.8093ms
That’s about 10 times better than my office location results and 5 times better than my home location results. Obviously, proximity matters. All data center tests were run against the full set of 1296618 documents.
Since this test is run simply from a website with a button, it’s pretty easy to run it simultaneously from separate browser tabs. So I opened ten tabs and clicked the button in each one (not a very scientific approach, I agree). Performance in each browser tab is comparable and between 7ms and 10ms consistently. Remember that each test consists of 4000 queries. Multiply this by the number of tabs and you have 40000 queries within approximately 40 seconds, with an average query response time within 10ms. I think this is quite impressive, especially considering the complete JSON junk I threw at DocumentDB.


