Quite often I run projects at existing VMware customers that are building a new Digital Workspace. And quite often, that Digital Workspace contains a VDI. Especially when a customer is already using VMware technology in their datacenter, vRealize Operations (vROps) is used to monitor the environment. Although vROps is a great solution, it’s not really sufficient to monitor the desktop side of things. Sure, you are able to monitor system resources and the underlying platform, but monitoring User Experience (UX) is something completely different. UX Monitoring focusses on everything directly related to the end user. And I believe that vROps falls a bit short when talking UX. In this post, I would like to explain why solutions like Goliath Performance Monitor and Goliath Application Monitor make a great alternative to vROps and can even compliment VMware’s solution.
The thing that Goliath does really well and where they were (to me) most known about, is their UX monitoring part of their solutions. UX, like I also explained in the VDI Design Guide, is one of the three types of monitoring for a VDI or DaaS related service. The others are service monitoring and capacity management (which combined are used to predict/avoid outages and rapidly respond in case an outage does happen). And since I already covered their UX monitoring quite comprehensive, I want to focus somewhat more on the less common known part: their datacenter integration. UX metrics (such as remoting protocol metrics, logon metrics, CPU/RAM metrics) are essential to measuring what the user is experiencing but are generally impacted by either the network or the infrastructure on which the virtual desktops are running. Let’s dig into how Goliath approaches the infrastructure bit.
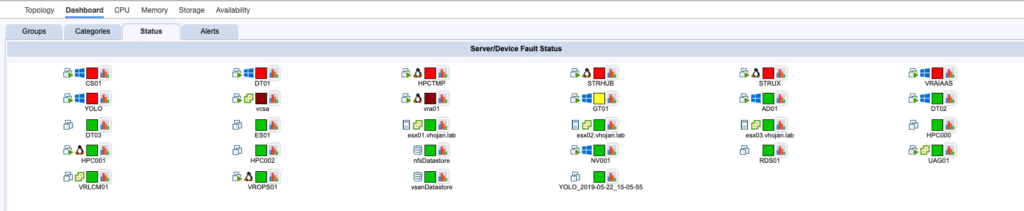
The main part of the portal is the Dashboard View:
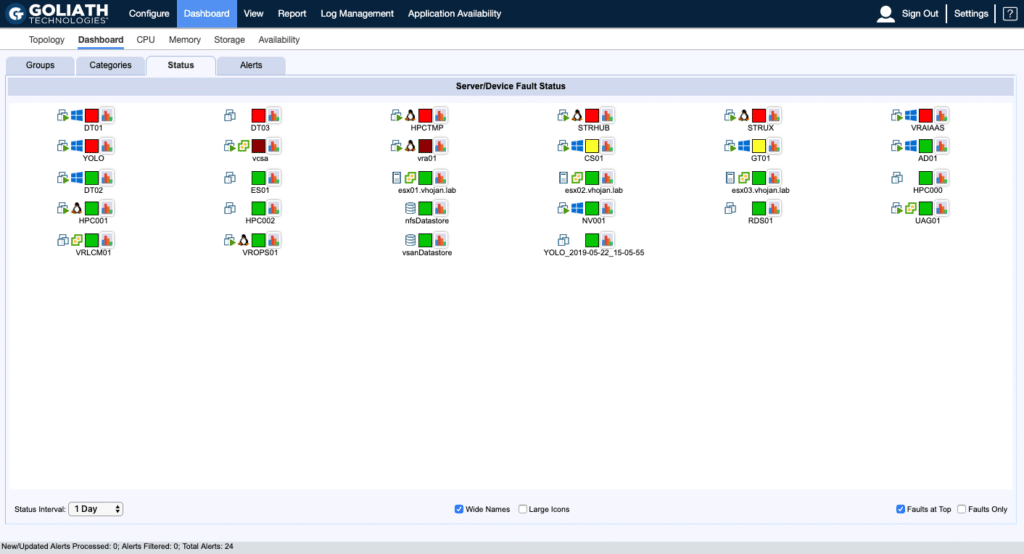
In the Dashboard View, it’s possible to get a high-level overview of the health of the entire VDI stack (VMs, Desktops, ESXi hosts, and Datastores). In case you are experiencing issues, the constraining resource or failing component can easily be viewed here. It shows all of the machines that are running on the VMware infrastructure but is also able to monitor physical machines that have a role in the infrastructure.
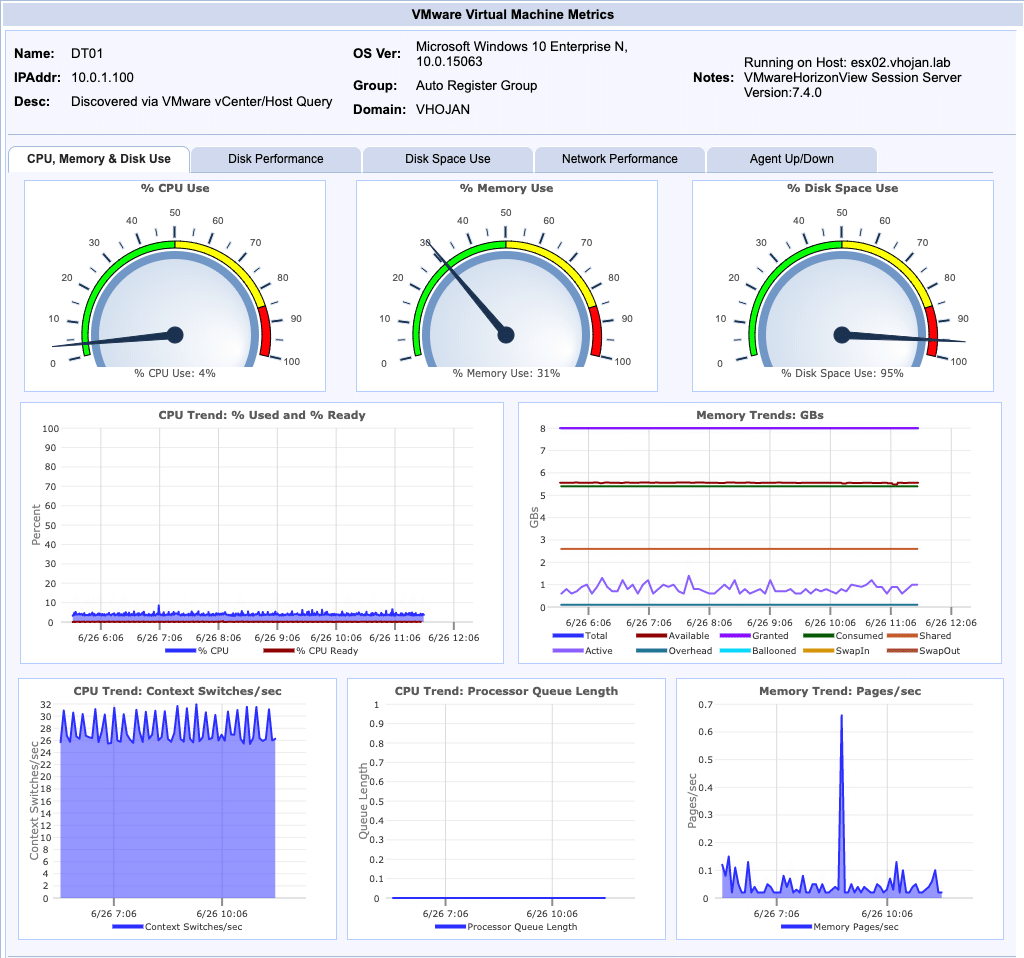
In case you need to drill down on a single VM or other objects, it is fairly simple to do so. Just by clicking on the object, the solution takes you to a deeper level of details.
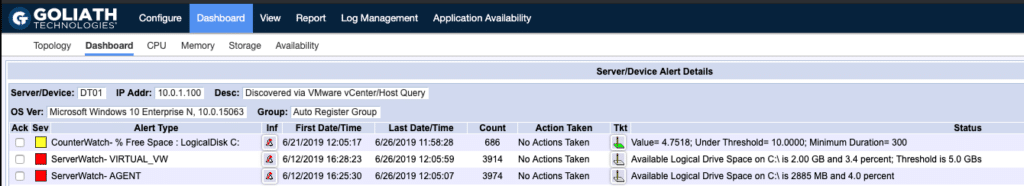
The cause of the possible issue is displayed in a simple overview. In the same window, you can even see the most important metrics that belong to the same object.
With these options to drill down to the infrastructure layer, you are able to get some more insights on how the complete stack is performing. But, in my opinion, this is still part of UX monitoring. Where it gets more exciting, is that with little adjustments, you can use Goliath Performance Monitor for service monitoring as well. I simply just added a couple of the services that runs on the Horizon Connection Server:
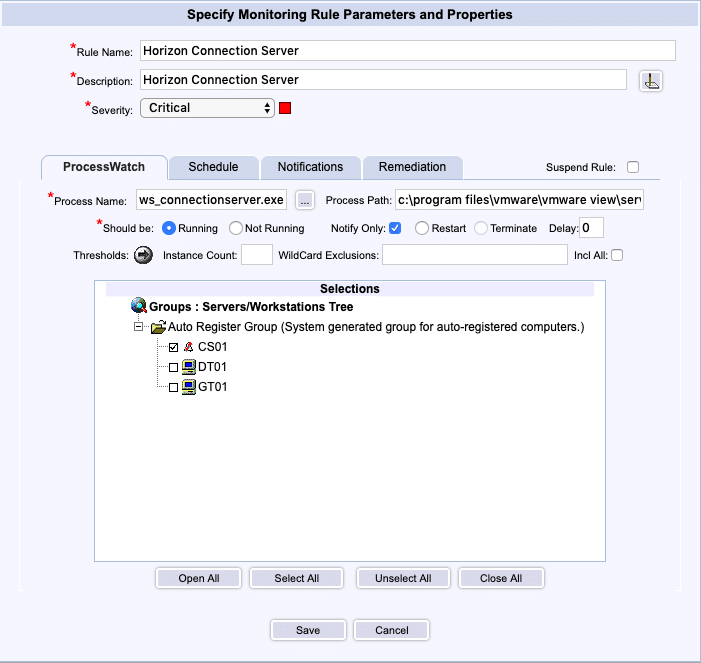
25 seconds after the Horizon Connection Server was killed, I received an SNMP trap and an email just a couple of seconds after that telling me that the service was unavailable.
You can also automatically try to remediate the issue, but for this demo, I choose not to. It’s also possible to add all kinds of other custom metrics you would like to monitor on, which makes it perfectly suitable to add the services of your entire stack to a single solution. Some of the most common services (like SQL, SMTP or HTTP) are already part of the alerts your are able to set up, but the custom ones can be created with things like syslog, SNMP traps or custom Windows/Unix/Linux scripts.
Conclusion
I hope I gave you an idea of the possibilities of Goliath’s solutions. Where they fit, depends on your situation. In case you already have vROps in place, you might be able to use Performance Monitor and Application Monitor for your UX metrics that are close to the end user. But, as vROps is included in the VMware Horizon Enterprise license only, there are tons of customers who are in need of an alternative. The complete suite of Goliath’s solutions can be a fine alternative. You can drill down to the physical resource level of hosts, storage and networking in case of performance issues and they offer SNMP, syslog or native service integration in case you would like to include service monitoring as well. If you are already a Citrix customer that is migrating to Horizon, keeping your Goliath stack might make sense since you are already familiar with how to monitor that. Both Citrix and Horizon monitoring can be combined in the same dashboard, which might make monitoring a lot easier during a migration. The solutions are fairly simple to set up and also adds integration to certain 3rd party application stacks, but more about that later 
The post VDI Stack Monitoring with Goliath Performance Monitor appeared first on vHojan.nl.
The original article was posted on: vhojan.nl