Some of the most common customer requirements for a new – or upgrade of a Digital Workspace are: we want to be more proactive and want to measure the User Experience. Sometimes users start complaining that everything is slow. Then they have to create a ticket. Firstline Helpdesk investigates the problem and if they can’t find the root cause, the ticket is escalated to the second line and so on. Meanwhile, your end users are unhappy and not productive.
A possible cause might be a full datastore, a network problem or a host that is unresponsive. These causes should be determined before the end-users even start complaining. Ideally, IT should be aware of the problem and already handling it. It’s a completely different approach than to be reactive and wait for end-users to start complaining. To gather this information about your environment you need a VDI monitoring solution.
In this post, I’ll review the VMware vRealize Operations for Horizon and eG Enterprise by eG Innovations, two monitoring solutions that have in-depth capabilities to monitor VMware Horizon digital workspaces. There are many other monitoring solutions, but there are too many to cover in one post. I explain what I like most about both products:
VMware vRealize Operations for Horizon
vRealize Operations for Horizon is a special version of vROPS that’s included in Horizon Enterprise. With vROPS for Horizon, you can monitor the health and performance of your entire VDI stack; vSphere, Horizon, Applications… You can expand it to monitor your entire datacenter if you buy the full version. One of the things that I like about vROPS for Horizon is that it’s web-based.
Web-based
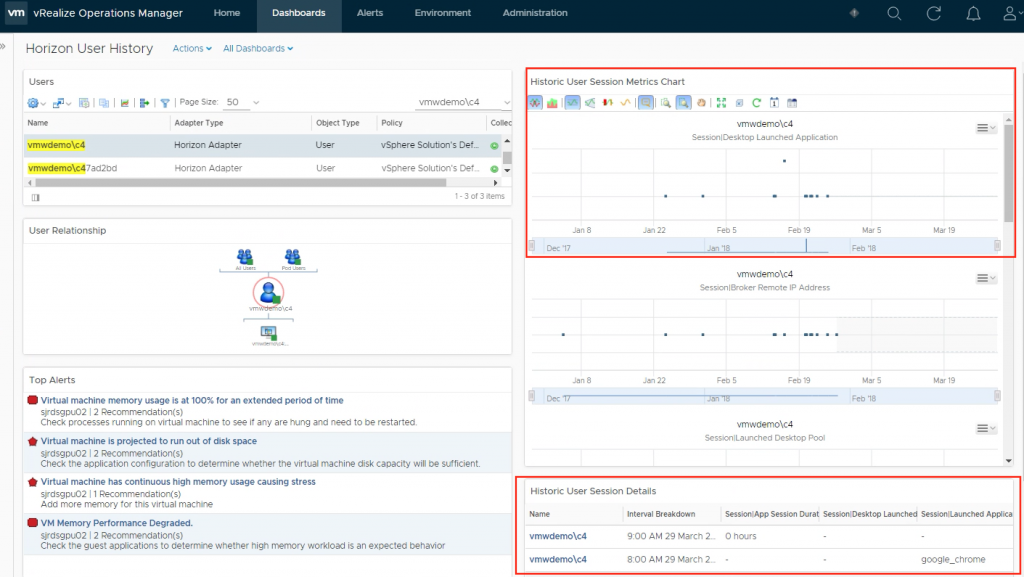
You can access vROPS for Horizon from any device that runs a modern browser like; Google Chrome or Mozilla Firefox. This offers great flexibility and you can access your data when and where you need it. Role-Based Access Control is supported and you can create different roles for your IT department. For example, read-only permissions for the Helpdesk. Out of the Box there are many different dashboards available with all different sets of information. You might want to view data that is split in multiple dashboards. With vROPS for Horizon, you can create your own custom dashboard.
Custom Dashboards
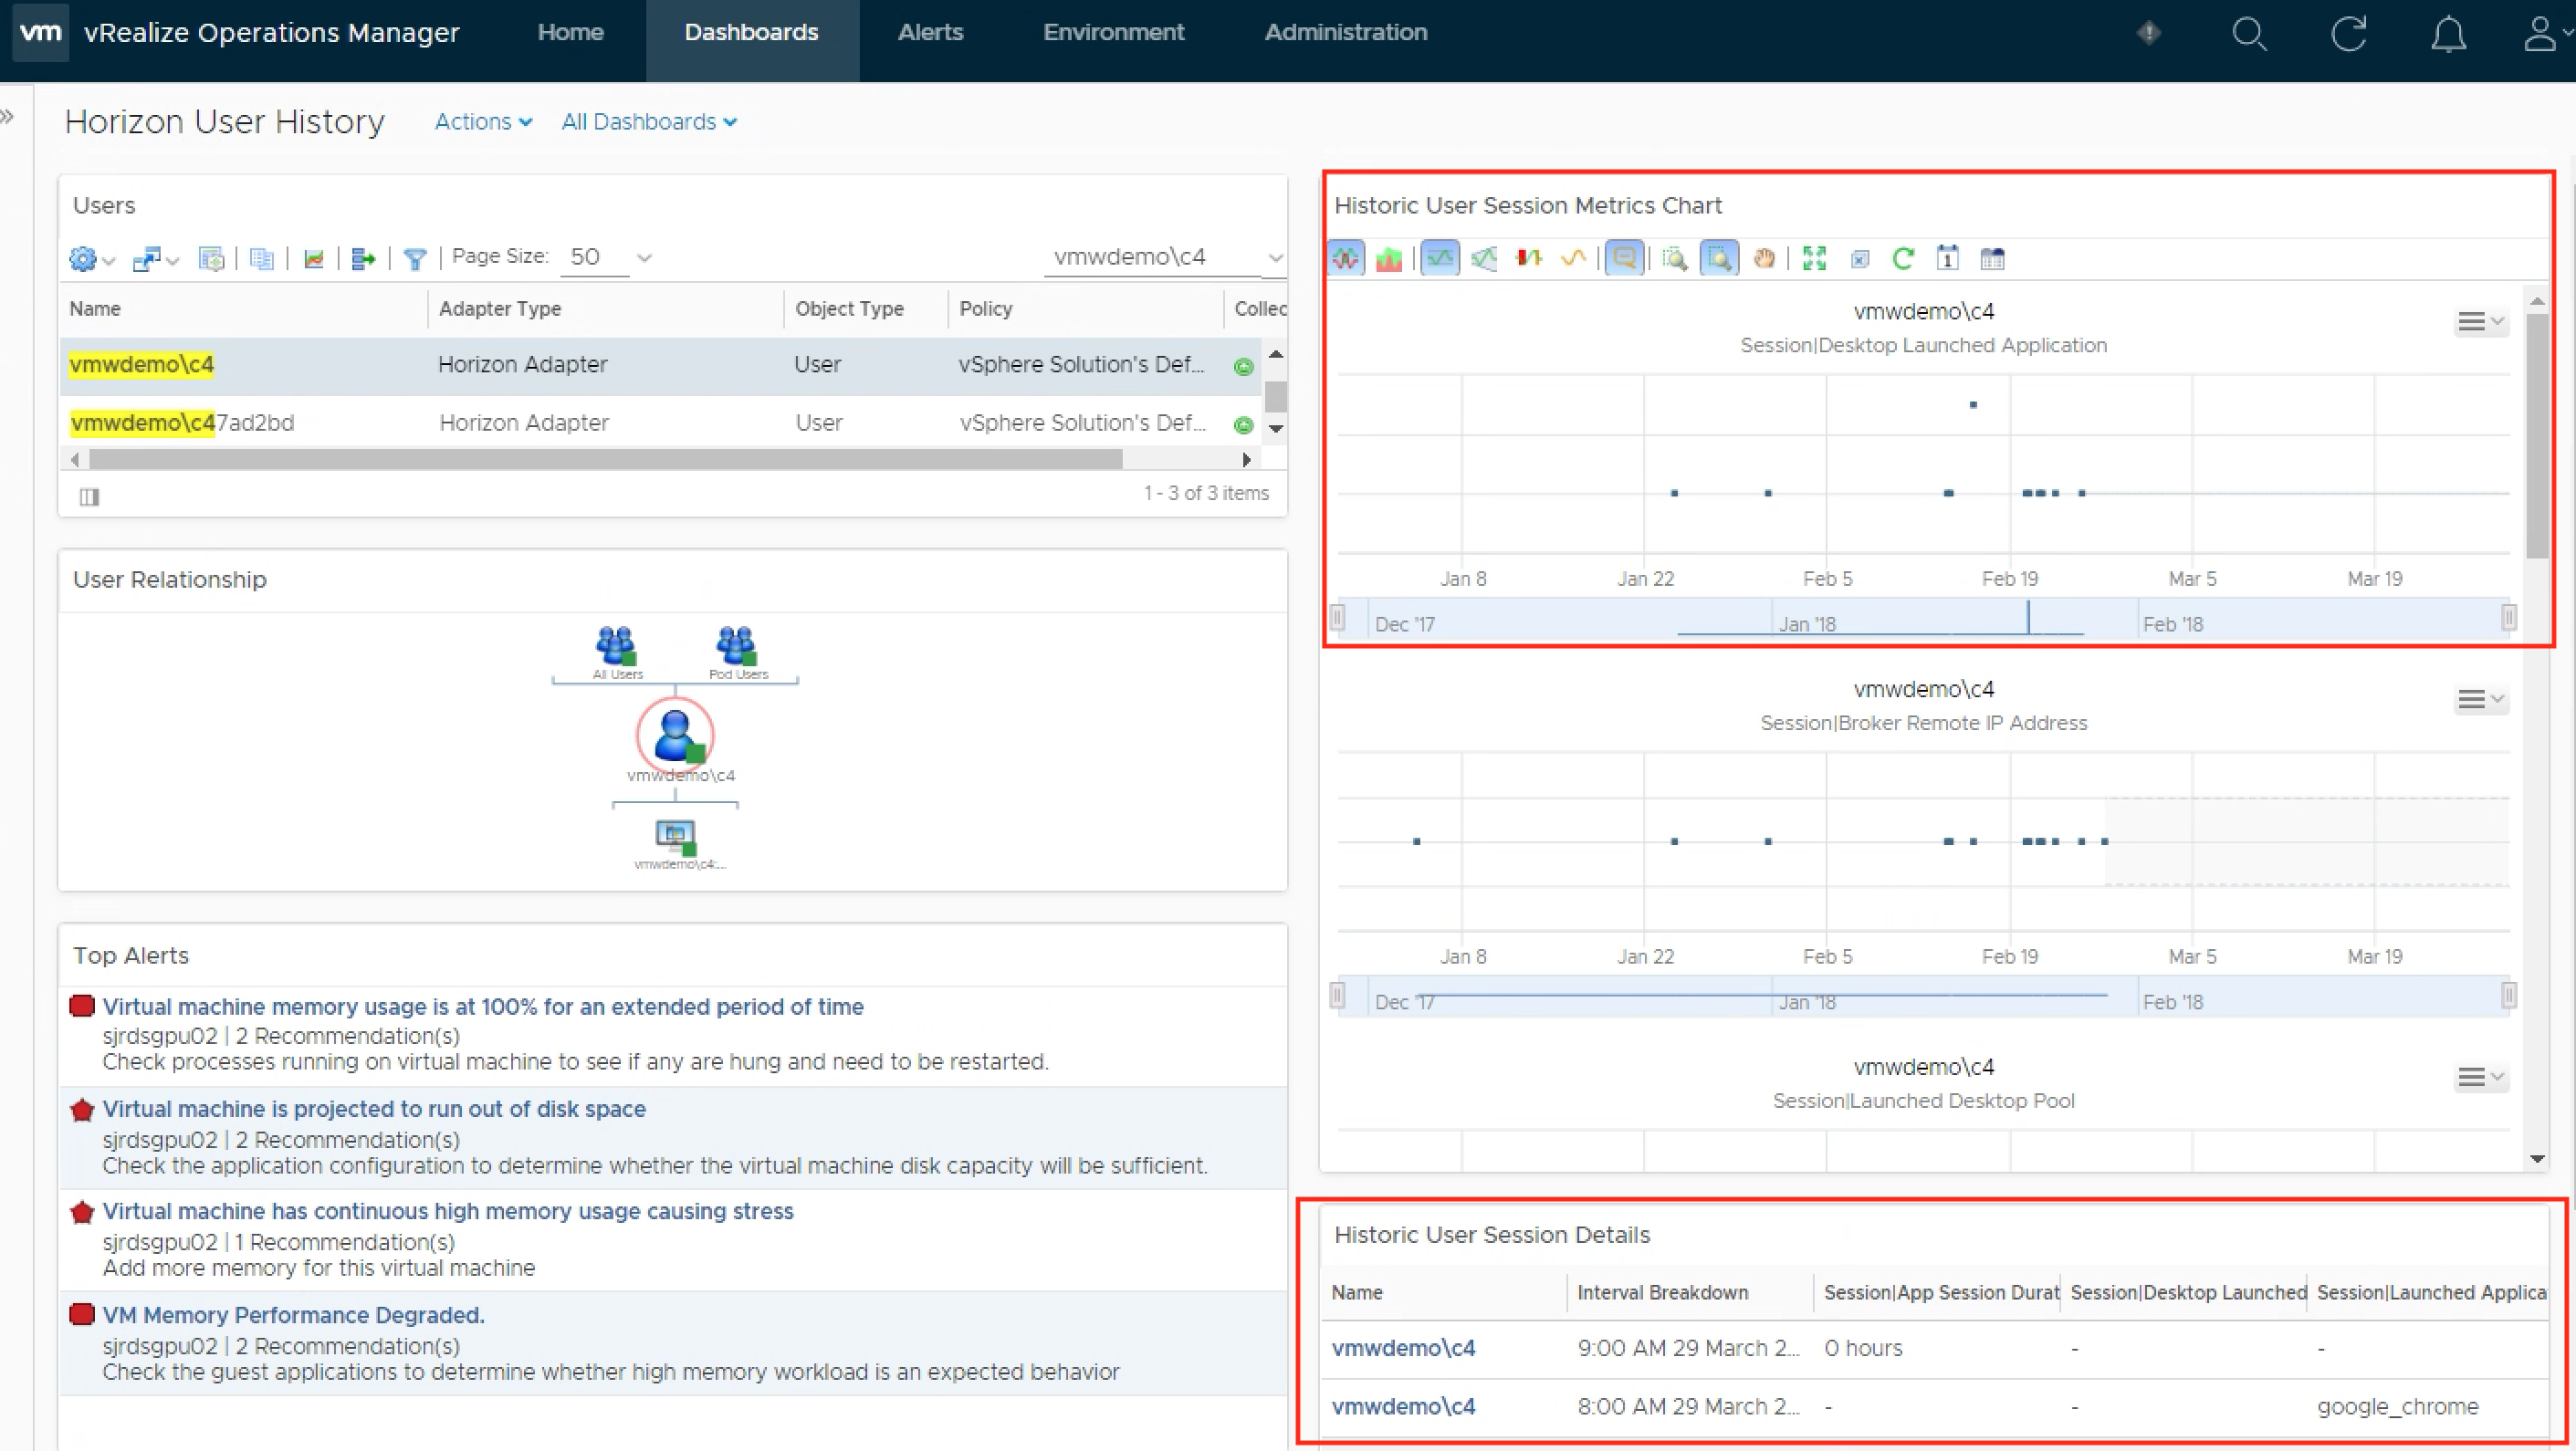
You can combine separate views with different metrics into one dashboard. This enables you to view the data that is most important for your environment. Creating your own (super) metrics is also possible and display the results in a dashboard. You can view a users current session latency but not the average session latency. You can create a super metric that calculates the average user session latency. Accordingly, you can compare it to the user’s current session latency. You can find how to create this super metric here. You can also create scheduled reports based on dashboards and metrics. For example, you can create a weekly report with the average session latency per user.
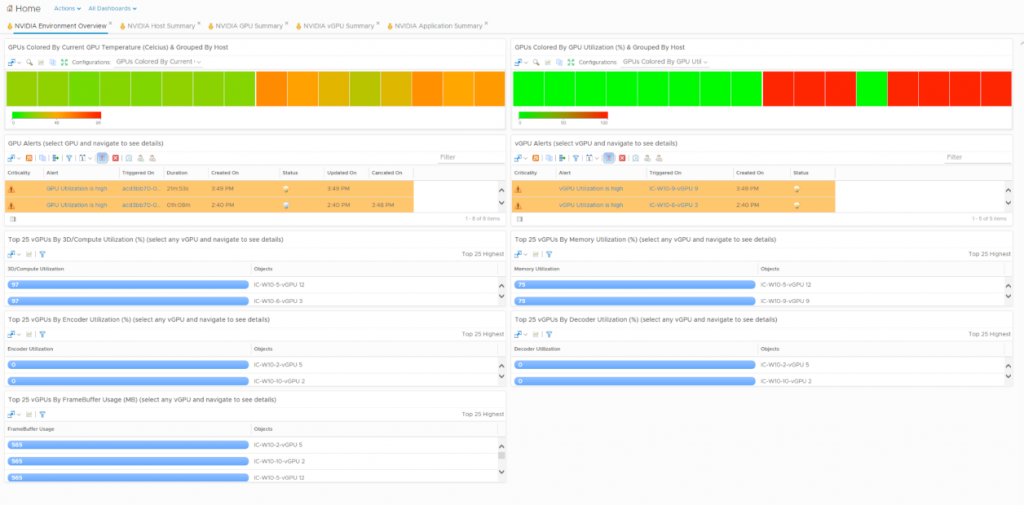
vROPS for Horizon Metrics
vROPS for Horizon offers a lot of metrics out of the box or if you are creative enough you can create your own (super)metrics. You can also monitor your NVIDIA vGPU’s with vROPS for Horizon. You can download the pak file from your NVIDIA costumer portal. vROPS for Horizon supports many dashboards from diverse products. The only downside is they are not all free of charge and you have to install them separately.
eG Enterprise by eG Innovations
eG Enterprise is also a complete end-to-end monitoring solution that measures all the aspects of the user experience; user logon, application launch, desktop access and many more. eG Enterprise can automatically isolate the root cause of the slowness and identify the affected users. It has built-in machine learning that can create baselines for correct sizing and capacity planning. With the Logon Simulator, you can proactively test the User Experience and the performance of your infrastructure.
Web-based
eG Enterprise is very easy to install, configure and use. You can access all the recorded data and metrics trough the eG Enterprise web-based console from any device with a modern web browser. This offers great flexibility and you can access your data when and where you need it.
End-to-End Relational overview
One of the features, I like most is the end-to-end relational overview of your complete environment. It Monitors every tier of the Horizon infrastructure (Connection Server, Identity Manager, Security Server, Composer, App Volumes, vSphere, vCenter, ESXi hosts etc.) but also the supporting infrastructure (network, AD, database, web apps, storage, cloud etc.) The image below is an overview of a complete Horizon Infrastructure. From one central dashboard, you can view the health of your complete infrastructure. If there is a problem with the F5 Big IP Traffic Manager it will show the impact on the related components.

You can zoom in on each component and you get a complete overview of all the different metrics that are being collected. It’s not just one metric that is being monitored, but many for each component. This can help you to quickly find the root cause of a performance problem and what the impact is. eG Enterprise provides automatic root-cause diagnosis and understands dependencies between various components, correlates performance metrics to isolate the root cause of the problem. (How awesome is that? 😉
(Free) Logon simulator
In every Digital Workspace project, an assessment is necessary to collect data to calculate the required hardware resources. After the assessment and the design, you need to validate what you designed in a proof of concept. There are some products available to perform load tests but it’s another investment your customer has to make. Wouldn’t it be great to perform load tests for free? eG Innovations has a free Logon Simulator available. With the tool you are able to:
- Simulate the exact steps that your users experience when they logon to VMware Horizon
- Tracks the time taken for every step of the Horizon logon process: Browser access, authentication, enumeration, session establishment, and application launch
- Detect logon issues proactively and helps troubleshoot them before end-users are affected
- Monitors the availability of published applications, such as Cerner, Epic, SAP, Outlook, Office 365, etc.
- Test if the entire Horizon infrastructure is working accordingly.
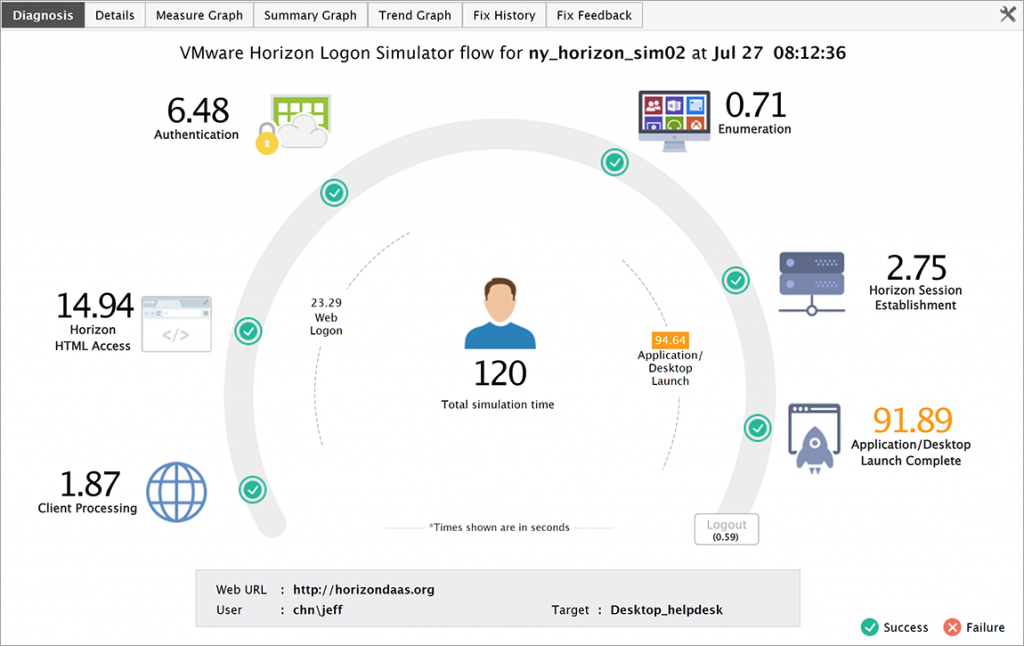
You can get the Free Logon Simulator here. There is also a version available for Citrix!
eG Enterprise monitors user experience from two perspectives – synthetic simulation and real user experience of every user session (logon time, app/desktop launch, latency, bandwidth, and more). The logon simulator was the synthetic component. For real user monitoring, eG Enterprise taps into VMware APIs and provides real-time session information for every user session: logon, latency, app/desktop launch, etc.
Application Monitoring
eG Enterprise is also capable of monitoring much more than only VMware Horizon or Citrix. In the picture is an example of a web application. You can create your custom own services so you can easily keep track of your mission-critical applications.

Conclusion
Both products have a lot more features but it would take several blog posts to cover them all. vROPS for Horizon and eG Enterprise are both great products with a rich feature set. Both products can help you in monitoring your applications and the End-Users Experience.
If you are looking for an easy setup and comprehensive tool that covers all the key VMware Horizon tiers and supporting infrastructure with different dashboards included. I would recommend eG Enterprise for VMware Horizon monitoring. Desktop-as-a-service and managed service providers supporting digital workspaces will also find eG Enterprise’s multi-tenancy and role-based access control capabilities to be invaluable as they have to support multiple customer environments and need a centralized control for doing so. If you are a vROPS expert then you can use eG Enterprise as a complementary tool for end-to-end visibility, automatic root-cause diagnosis, and proactive synthetic monitoring.
The original article was posted on: maartencaus.be